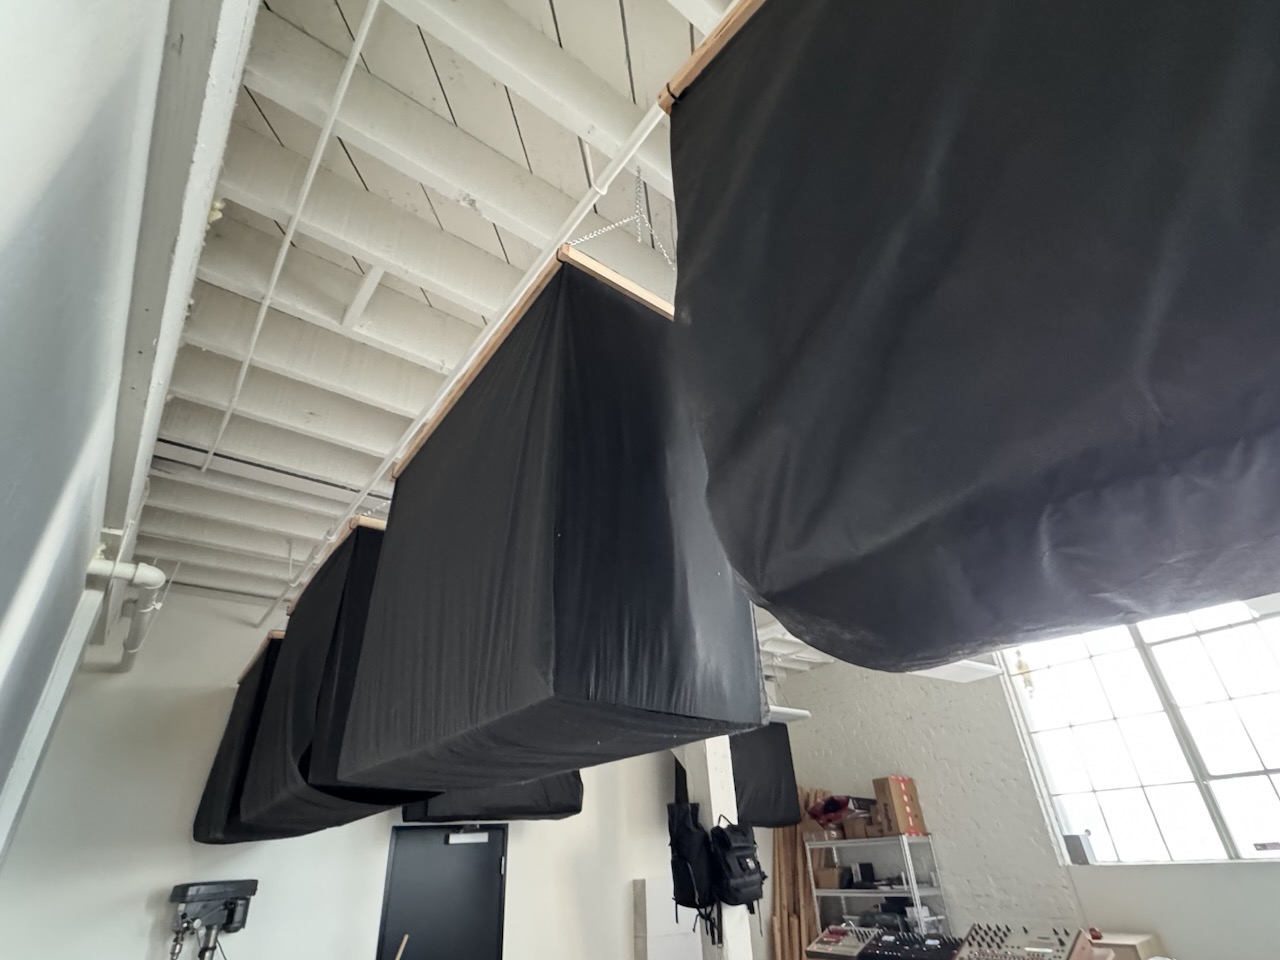
Bass treatment for our studio, measured with REW at every step. Six deep absorbers so far bring the T20 down to 0.3–0.5 s from 100 to 250 Hz.
acoustics
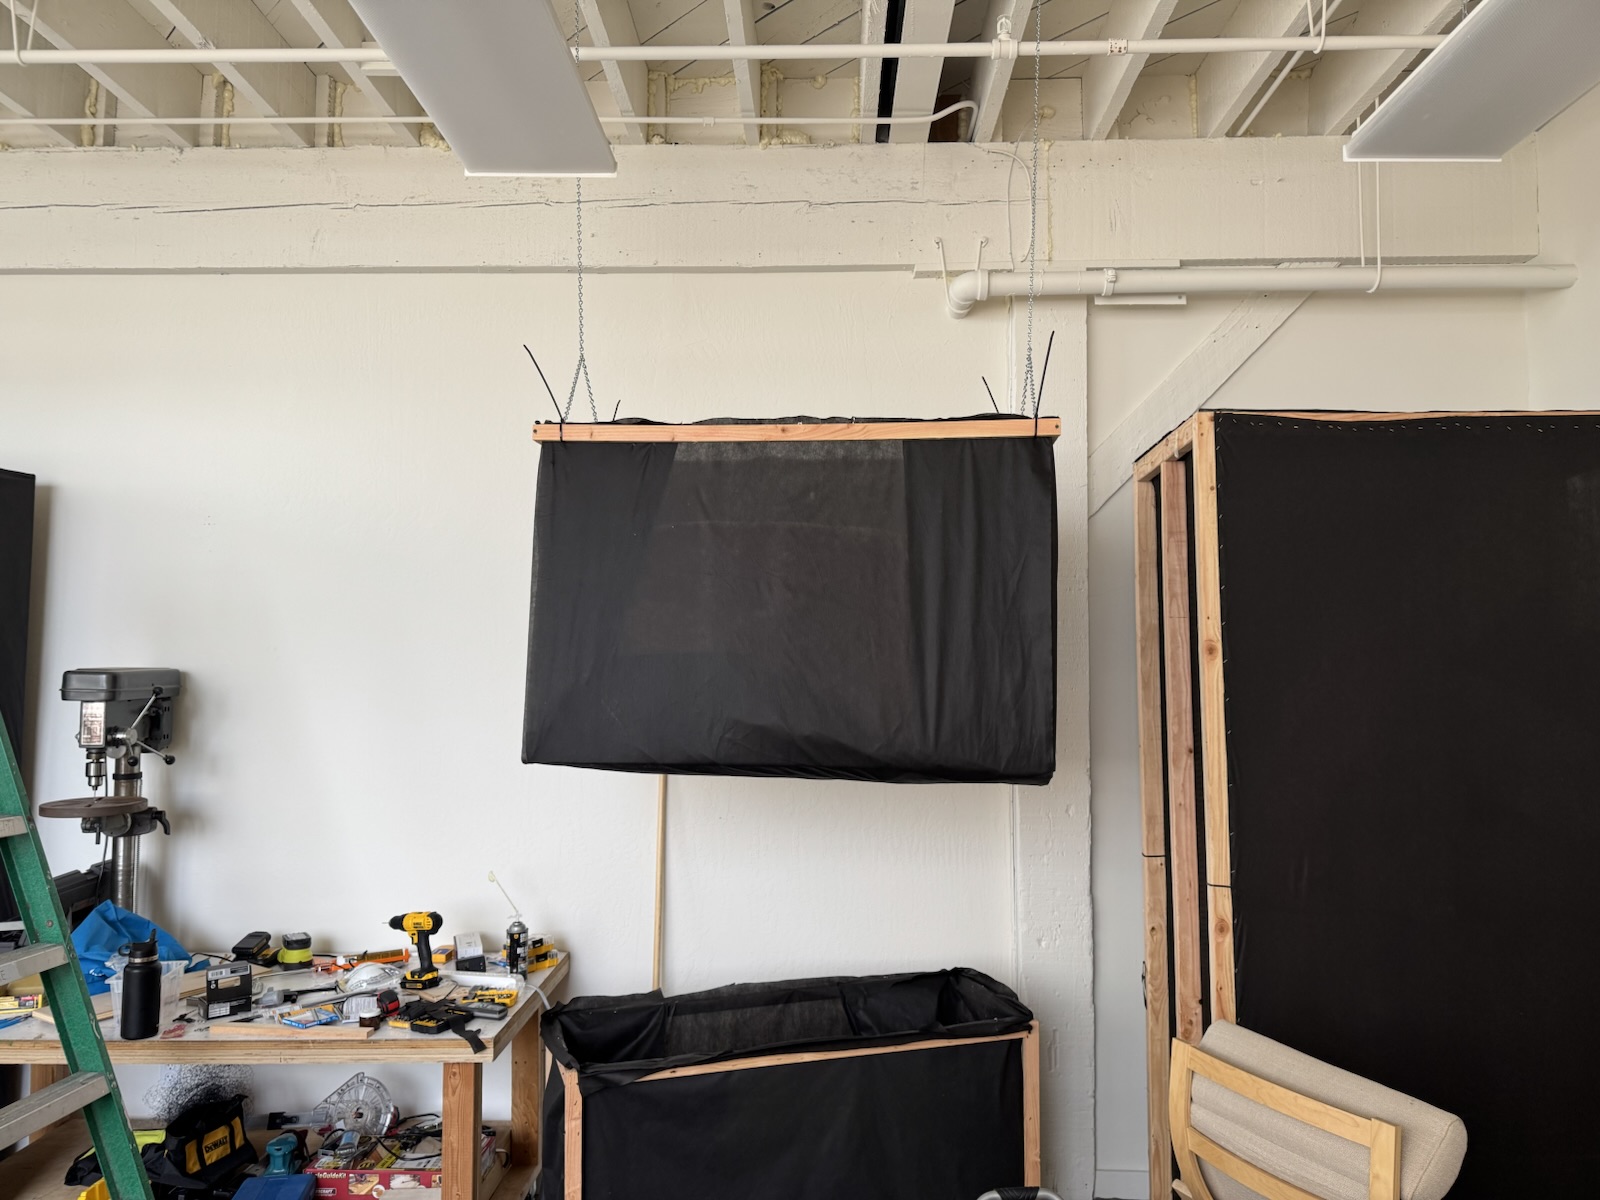
Layer one: deep absorbers hung 2 ft off the walls.
the problem
The room is 13 × 21 × 23 ft, about 178 m³. Axial modes at 25, 27 and 43 Hz plus their harmonics make bass notes swing a lot in level and decay. Thin panels do almost nothing below 100 Hz and would leave about ±10 dB at 80–90 Hz, which is no good for mixing.
the plan
Measure, build one layer, measure again. Layer one is deep absorbers hung off the walls, and it's done. Layer two is absorbers at the reflection points on the back wall, side walls and ceiling. Layer three is tuned Helmholtz resonators for whatever's left. We also checked the room's dimensions against the modes we measured instead of trusting the floor plan.
layer one
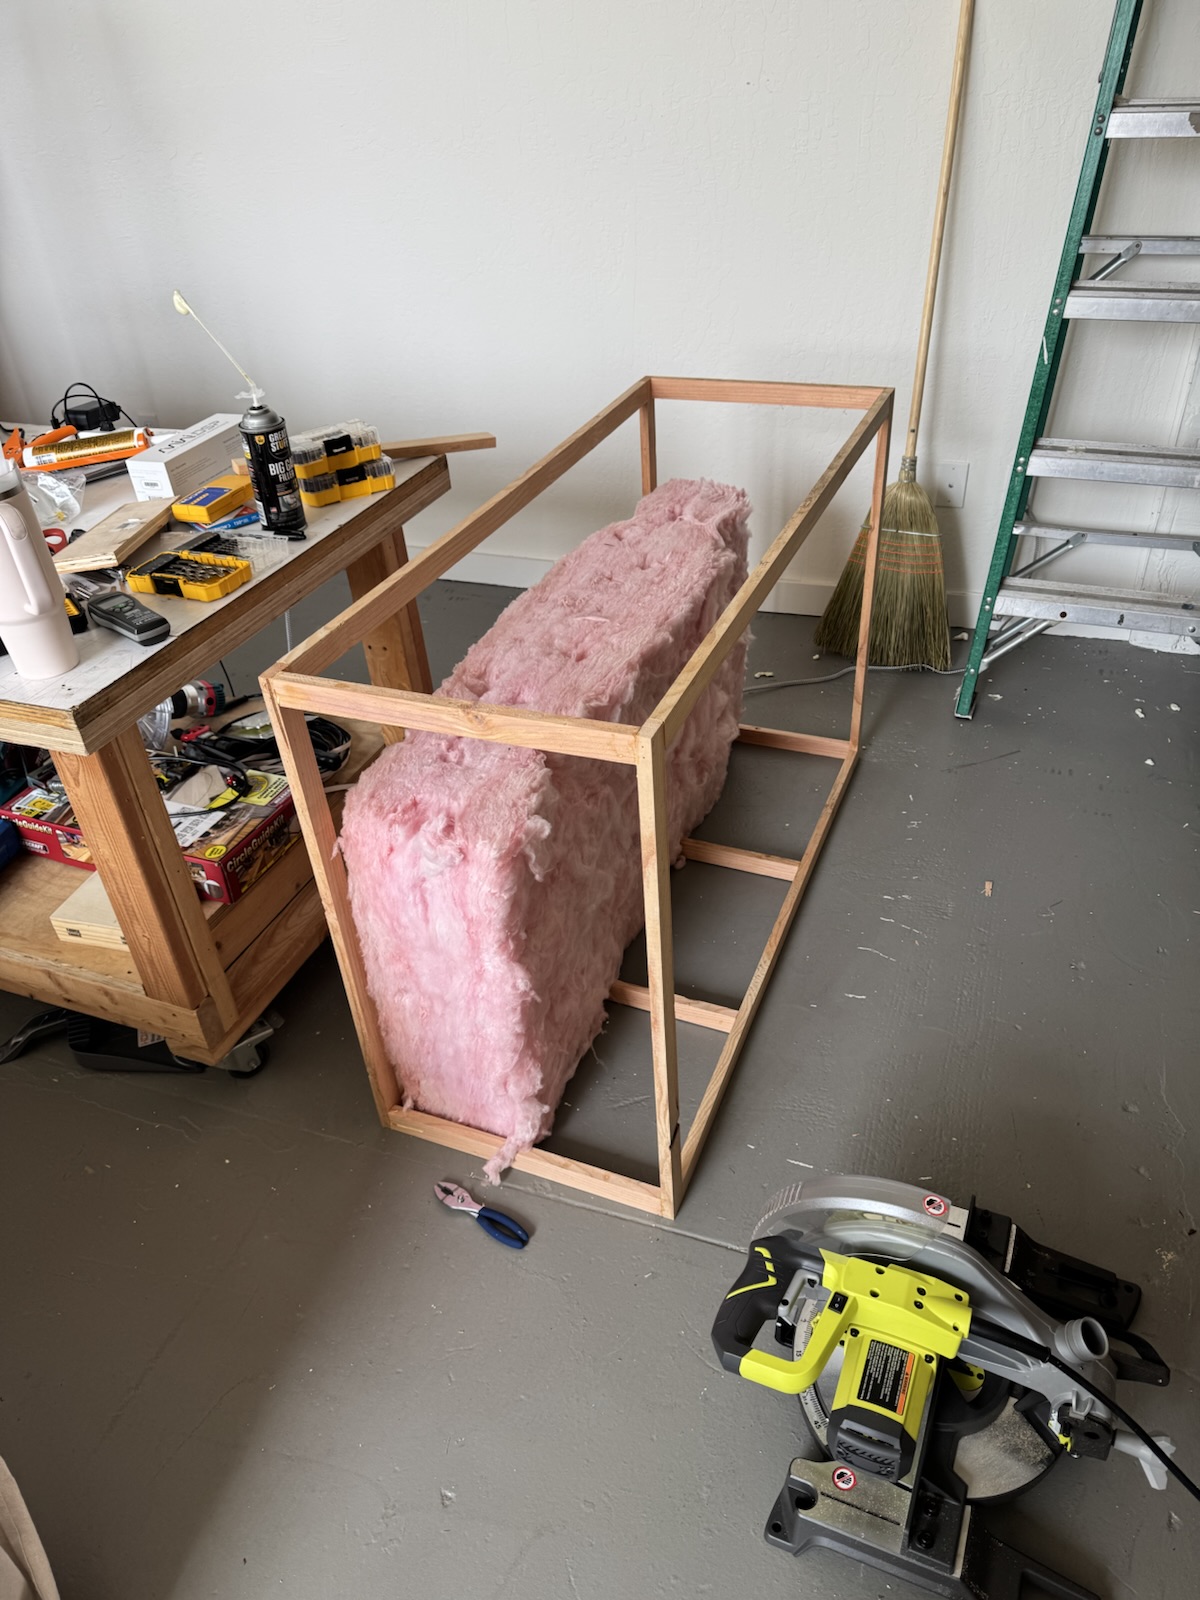
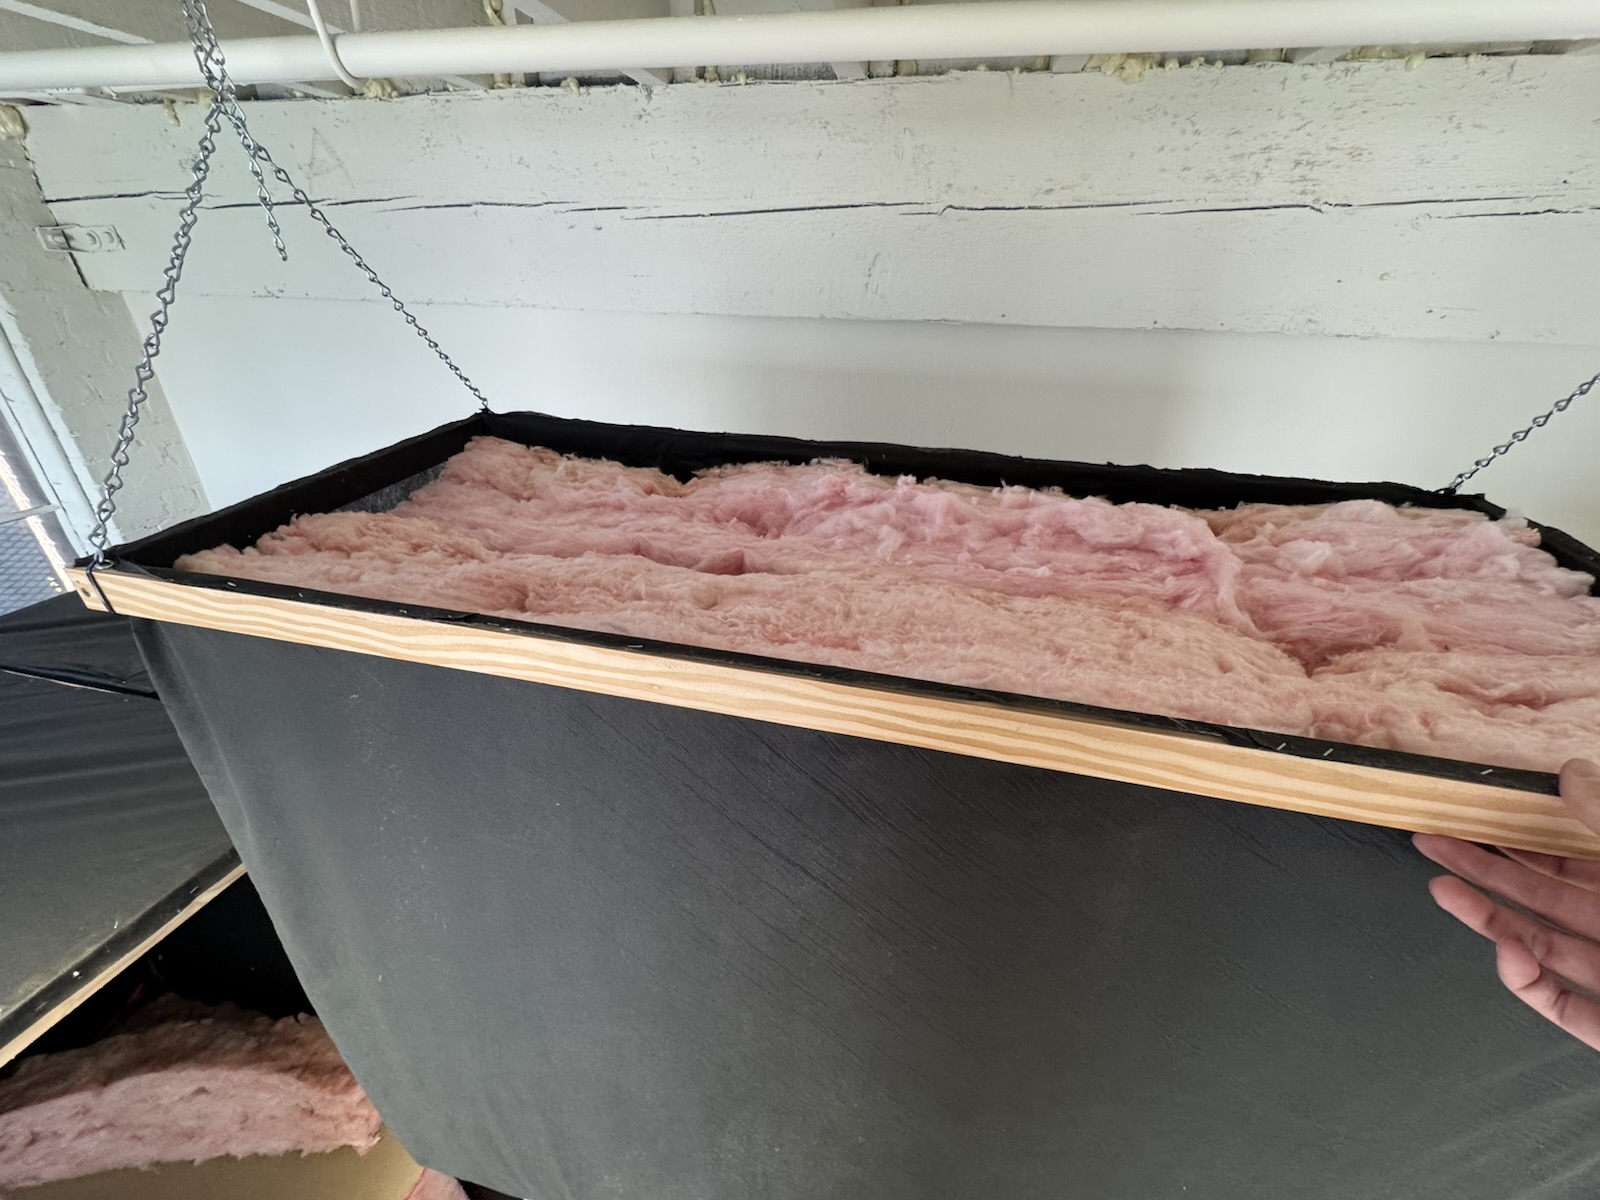
Six absorbers, 40 × 48 × 20 in: timber frames of R-30 fibreglass wrapped in black fabric, hung 2 ft off the walls. Porous absorbers work best a quarter wavelength out from the wall, so the depth plus the air gap is what gets them down into the bass.
measurements
19 log sweeps on August 1, 2026, with REW and a UMIK-1, at the mix position and one other spot. The charts are from the raw impulse responses with 1/6-octave smoothing.
T20 per third-octave band at the mix position, the median of seven sweeps with the range as lines. 100–250 Hz are within EBU Tech 3276 for this room (Tm 0.30 s). 63 and 80 Hz are still at 0.8–0.9 s, which is what layer two is for.Energy decay in four bands. Each hits the noise floor, the flat tails on the right, within about 0.5 s.Frequency response at the mix position, both speakers, averaged over seven sweeps. Within about ±4 dB from 40 to 500 Hz, except for a notch at 111 Hz.Harmonic distortion at the mix position, against the measurement's noise floor. From 40 Hz to 10 kHz it reads 0.1–0.6%, which is the noise floor, so the speakers' real distortion is that or lower.The notch moves from 111 Hz to about 120 Hz between positions. A room mode wouldn't move like that, but a reflection off the front wall would, so the fix is moving the speakers. More absorption won't help it.
what's next
Layer two, reflection-point absorbers and a ceiling cloud, for 63 and 80 Hz. Then moving the speakers to fix the 111 Hz notch, and measuring after each change.